Mastering Single-Cell RNA-Seq Analysis in R - Post 11: How to Actually Assess Clustering Quality! Link to heading
Ever wondered if your clusters represent real biology or just algorithmic artifacts? After choosing superior clustering algorithms in Post 10, you face a critical question: how do you know if your clusters are actually meaningful?
Today we’re diving into clustering trees - the ultimate tool for evaluating whether your cell type assignments are stable, trustworthy, and represent genuine biological distinctions!
🎯 The Clustering Quality Crisis Link to heading
The Fundamental Problem Link to heading
Just because you have clusters doesn’t mean they’re biologically meaningful. Many researchers fall into the trap of assuming that any clustering result represents real cell types, leading to false discoveries and irreproducible science.
The Hidden Dangers:
- Algorithmic artifacts masquerading as biological populations
- Parameter-sensitive results that change with minor tweaks
- Unstable boundaries that don’t reflect genuine cellular distinctions
- Over-interpretation of computational convenience as biological reality
The Need for Systematic Validation Link to heading
The Questions Every Cluster Needs to Answer:
- Do these boundaries represent stable biological distinctions?
- Would I get similar results with slightly different parameters?
- Are these clusters robust to algorithmic choices?
- Can I trust these assignments for downstream analysis?
Without systematic validation, your beautiful UMAP plots might be leading you toward months of chasing computational phantoms instead of discovering cellular biology.
🌳 Enter Clustering Trees: The Cluster Genealogy Tool Link to heading
What Clustering Trees Reveal Link to heading
Think of clustering trees as “cluster genealogies” that show how cellular populations split and merge as you systematically vary resolution parameters. They provide a comprehensive view of clustering behavior across the parameter space.
The Core Insight:
Real biological populations should appear as stable entities across multiple resolution values. Algorithmic artifacts will appear and disappear randomly or show chaotic splitting/merging patterns.
The Systematic Approach Link to heading
library(clustree)

# Generate clustering across multiple resolutions
resolutions <- c(0.1, 0.2, 0.3, 0.4, 0.5, 0.6, 0.7, 0.8, 0.9, 1.0)

for(res in resolutions) {
  ifnb <- FindClusters(ifnb,
                       resolution = res,
                       algorithm = 4,  # Leiden
                       verbose = FALSE)
}

# Create clustering tree
clustree(ifnb, prefix = "RNA_snn_res.")
Links: clustree Package | clustree Documentation
The Visual Language of Stability Link to heading
Tree Structure Elements:
- Nodes: Individual clusters at each resolution
- Edges: Connections showing how clusters split/merge
- Colors: Cluster identity and stability metrics
- Node Size: Cluster size (number of cells)
- Edge Thickness: Strength of connection between resolution levels
🔬 Reading Clustering Trees Like a Professional Link to heading
Interpreting Stability Patterns Link to heading
Stable Clusters (Good Biology):
- Consistent branches that persist across multiple resolutions
- Clean splits when they do divide at higher resolutions
- Logical merging patterns at lower resolutions
- High stability scores indicated by color intensity
Unstable Clusters (Algorithmic Artifacts):
- Chaotic splitting/merging with minor parameter changes
- Inconsistent appearance across similar resolution values
- Fragmented pathways with no clear biological logic
- Low stability scores suggesting computational noise
The Stability Score System Link to heading
Clustering trees quantify stability using several metrics:
SC3 Stability:
Measures how consistently cells within a cluster stay together across different resolution parameters. Higher scores (closer to 1.0) indicate more stable, trustworthy clusters.
Visual Encoding:
- Dark colors: High stability scores (trustworthy clusters)
- Light colors: Low stability scores (suspicious clusters)
- Color gradients: Allow quick identification of the most reliable populations
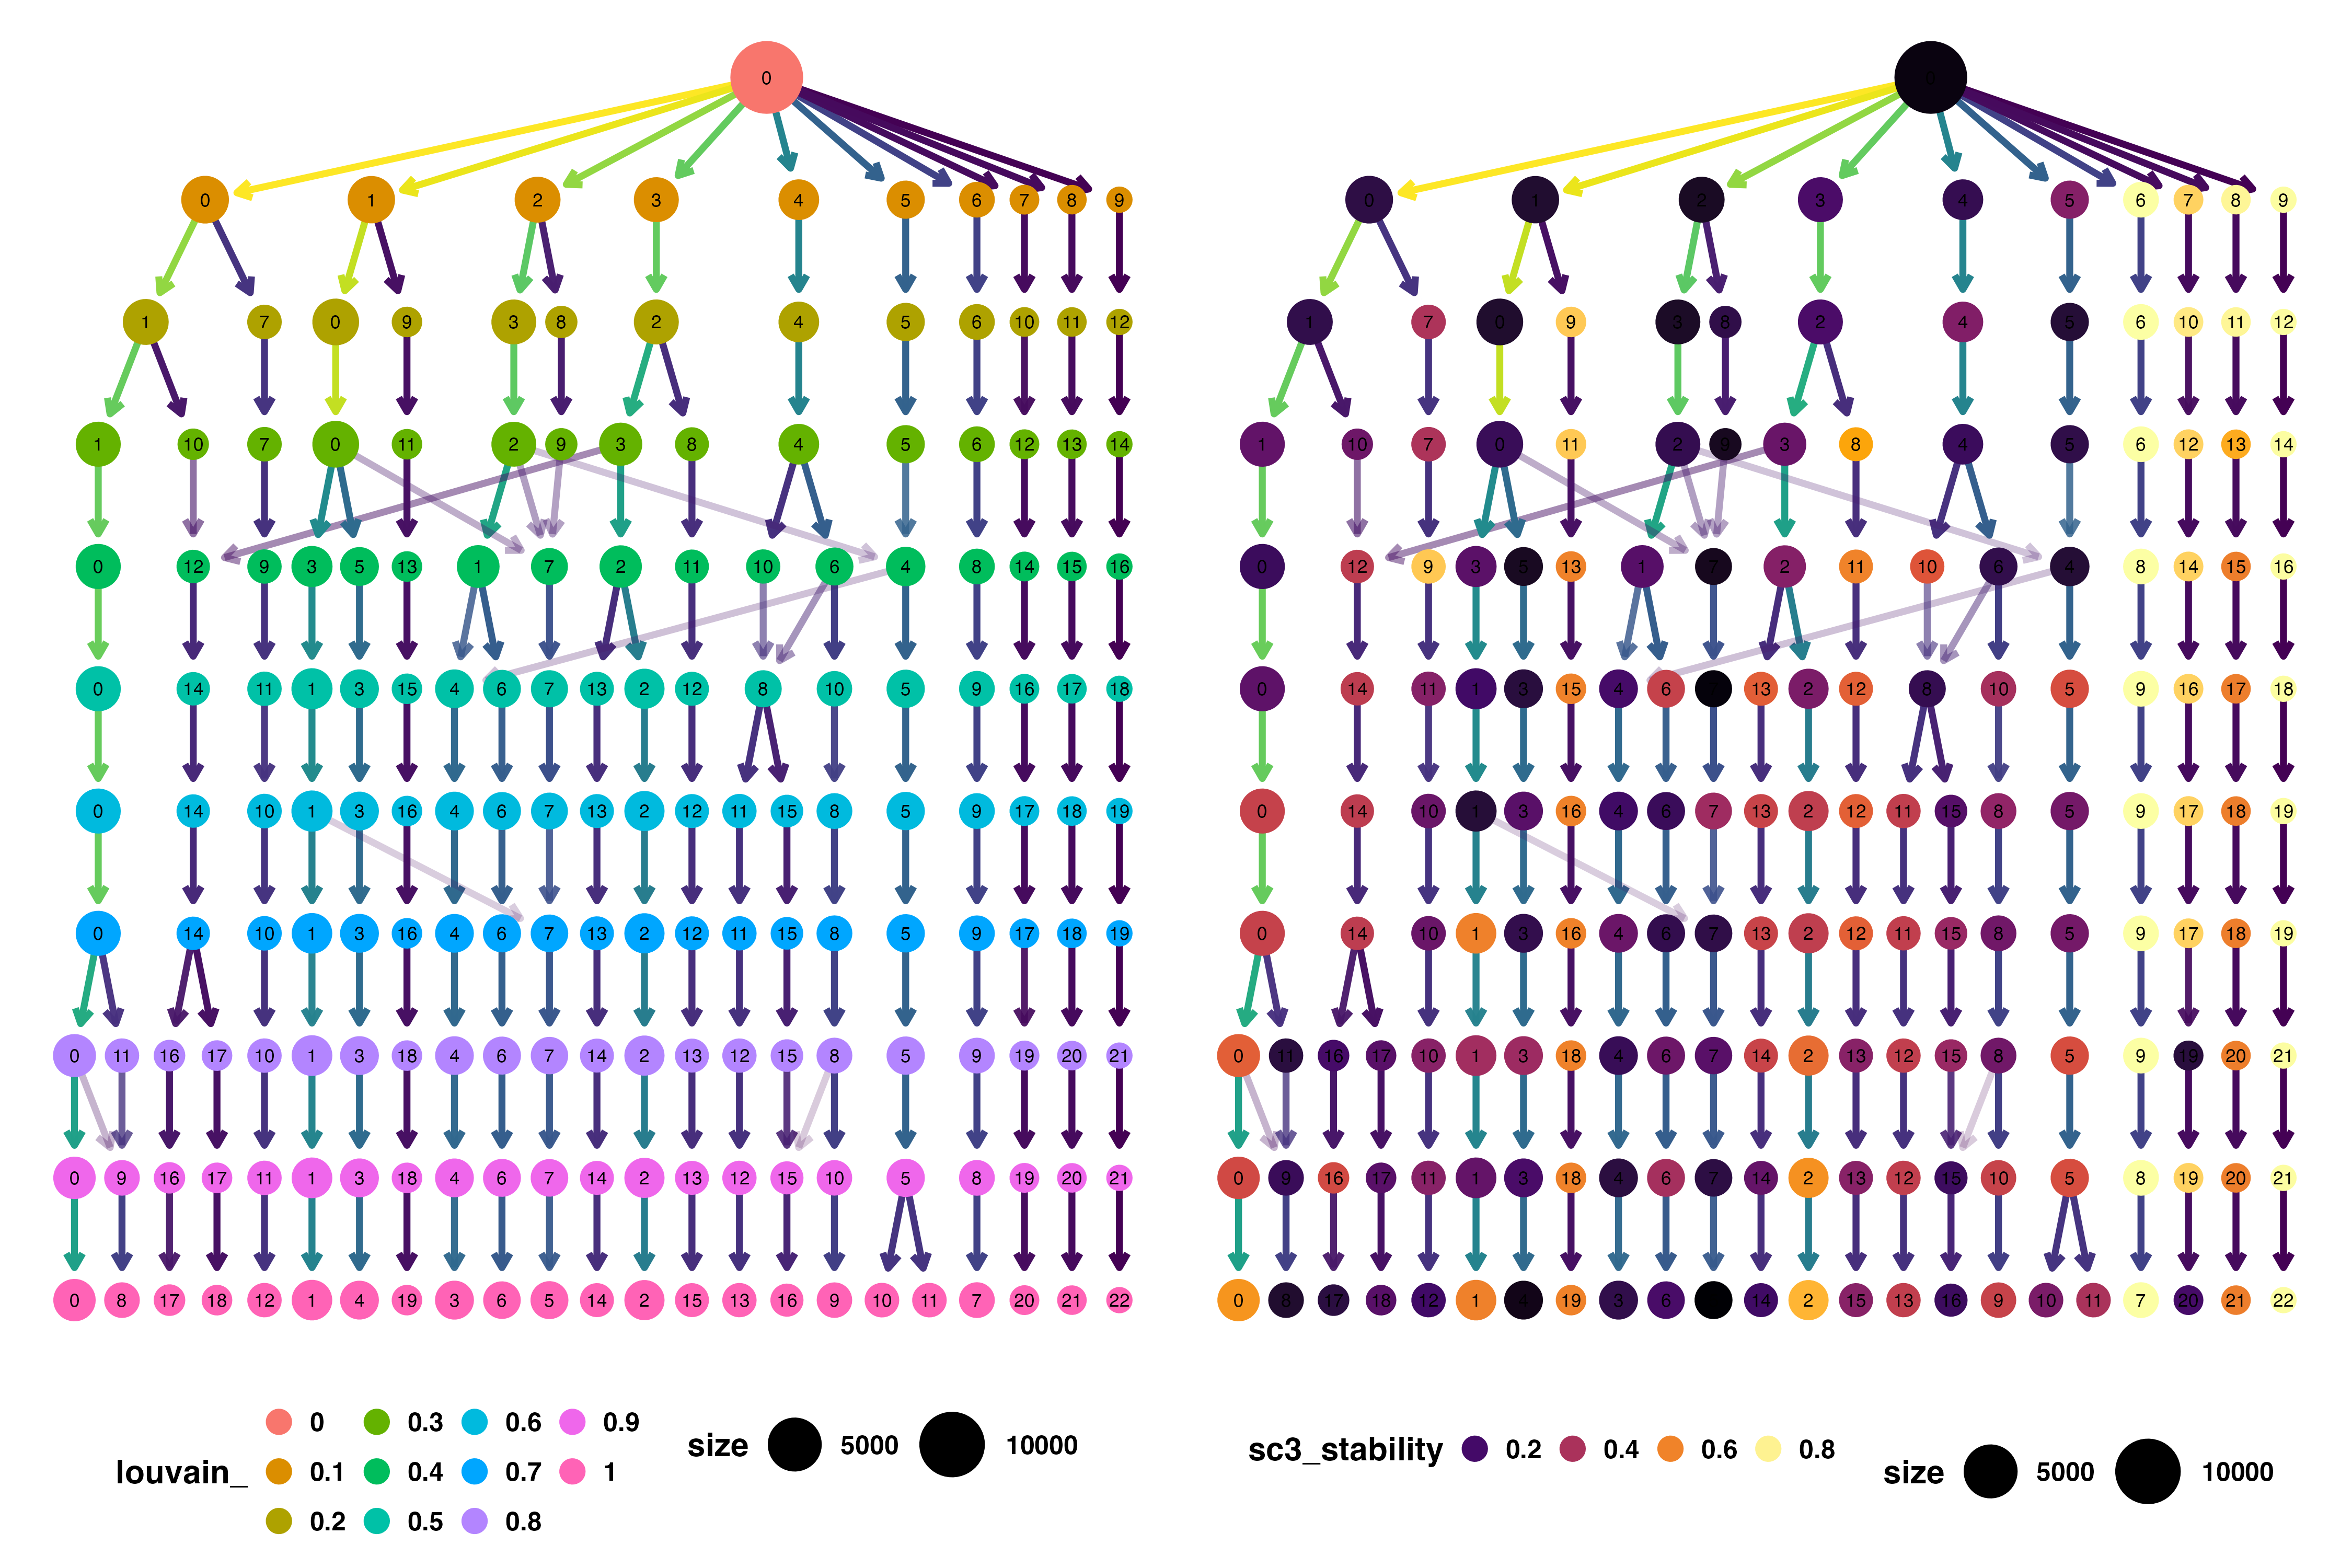
🔥 The IFNB Dataset Comparison: Louvain vs Leiden Trees Link to heading
Systematic Algorithm Comparison Link to heading
The clustering trees from the IFNB dataset provide compelling visual evidence of why algorithm choice matters for clustering quality and biological interpretability.
Louvain Clustering Tree Analysis Link to heading
What the Tree Reveals:
- More fragmented structure with numerous small, unstable clusters
- Chaotic splitting patterns suggesting algorithmic instability
- Lower overall stability scores across most resolution values
- Inconsistent cluster formation that varies unpredictably with parameters
Biological Implications:
The fragmented tree structure suggests that many of Louvain’s clusters represent computational artifacts rather than genuine biological populations.
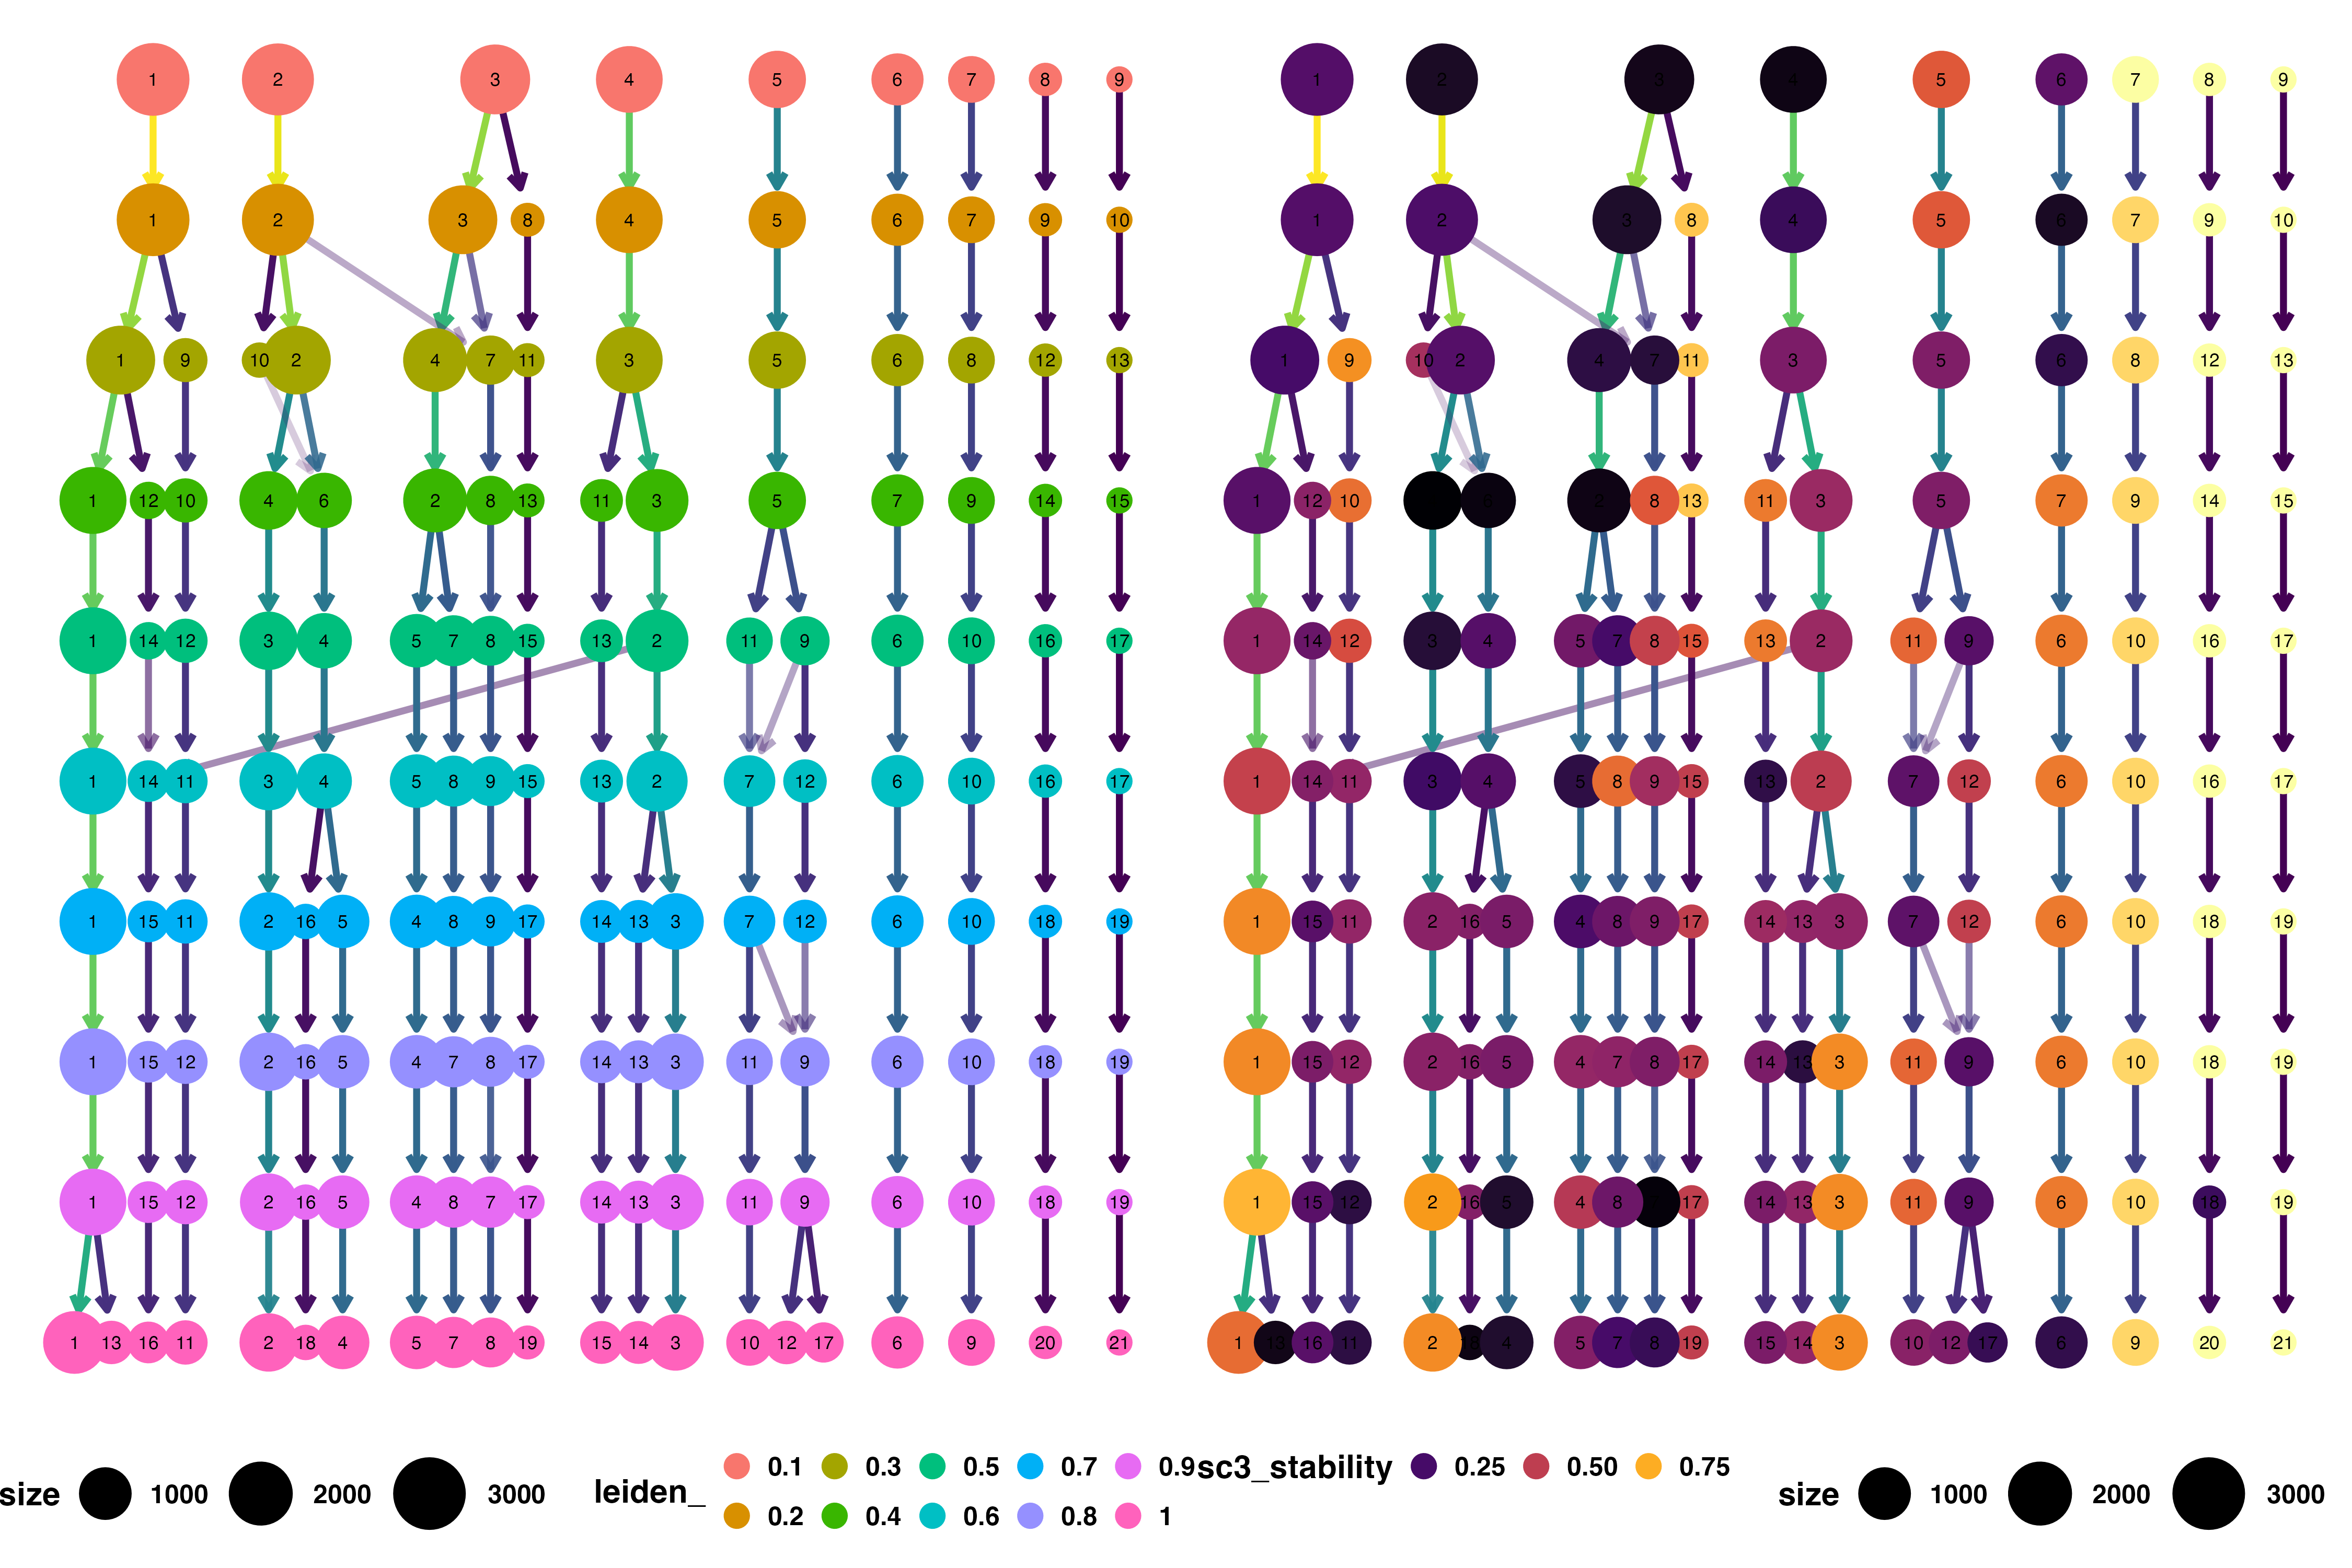
Leiden Clustering Tree Analysis Link to heading
What the Tree Reveals:
- Cleaner, more organized structure with logical hierarchical relationships
- Stable major branches representing robust biological populations
- Higher stability scores across the resolution range
- Predictable splitting patterns that follow biological logic
Biological Advantages:
The organized tree structure indicates that Leiden’s clusters are more likely to represent genuine cellular populations that will replicate across experiments.
The Quantitative Evidence Link to heading
Stability Score Comparison:
Leiden consistently produces clusters with higher stability scores, indicating:
- More reproducible results across parameter variations
- Greater biological reliability for downstream analysis
- Reduced risk of chasing algorithmic artifacts
- Enhanced confidence in biological interpretations
💪 Practical Applications: Using Trees for Method Validation Link to heading
Resolution Optimization Strategy Link to heading
Step 1: Generate Comprehensive Trees
Run clustering across a wide range of resolutions (0.1-1.0) to capture the full parameter landscape.
Step 2: Identify Stable Regions
Look for resolution ranges where your clusters of interest show high stability scores and logical splitting/merging patterns.
Step 3: Choose Optimal Parameters
Select resolution values that maximize stability for your biological questions while providing appropriate granularity.
Step 4: Validate Across Algorithms
Compare trees from different algorithms to identify method-independent stable populations.
Quality Control Integration Link to heading
Incorporating Trees into QC Workflow:
# Standard workflow with tree validation
ifnb <- ifnb %>%
  FindNeighbors(dims = 1:30) %>%
  # Test multiple resolutions
  FindClusters(resolution = c(0.2, 0.4, 0.6, 0.8), algorithm = 4)

# Generate validation tree
tree_plot <- clustree(ifnb, prefix = "RNA_snn_res.")

# Choose optimal resolution based on tree structure
ifnb <- FindClusters(ifnb, resolution = 0.5, algorithm = 4)
Cross-Validation Applications Link to heading
Batch Effect Detection:
Trees can reveal whether clustering patterns are consistent across experimental batches or driven by technical artifacts.
Method Comparison:
Systematic comparison of clustering algorithms, normalization methods, or preprocessing choices using tree stability metrics.
Parameter Sensitivity Analysis:
Quantitative assessment of how sensitive your biological conclusions are to parameter choices.
🧠 Beyond Visual Inspection: Quantitative Validation Link to heading
Stability Metrics for Decision Making Link to heading
Choosing Clusters Based on Evidence:
- Prioritize high-stability clusters for downstream analysis
- Treat low-stability clusters as potentially artifactual
- Use stability scores to guide biological interpretation
- Document validation for reproducible science
Integration with Downstream Analysis Link to heading
Differential Expression Quality:
Stable clusters produce cleaner differential expression results because they represent more homogeneous cellular populations.
Cell Type Annotation Confidence:
High-stability clusters are more likely to map clearly to known biological cell types, reducing annotation ambiguity.
Trajectory Analysis Reliability:
Stable clustering provides better starting points for developmental and transition analysis.
🚀 Advanced Applications: Multi-Resolution Analysis Link to heading
Hierarchical Cluster Understanding Link to heading
Biological Hierarchy Discovery:
Trees reveal natural hierarchical relationships between cell types, showing how broad categories (e.g., “T cells”) subdivide into specific subtypes (e.g., “CD4+ T cells”, “CD8+ T cells”).
Resolution-Dependent Insights:
Different resolution values are appropriate for different biological questions:
- Low resolution: Major cell type identification
- Medium resolution: Subtype discrimination
- High resolution: State and activation differences
Multi-Dataset Validation Link to heading
Cross-Study Consistency:
Generate trees for multiple related datasets to identify clusters that replicate across experimental conditions and biological contexts.
Batch Integration Validation:
Use trees to verify that integration methods preserve genuine biological structure while removing technical artifacts.
🎉 The Strategic Impact: From Guesswork to Evidence Link to heading
The Confidence Transformation Link to heading
Before Clustering Trees:
“I have clusters, and they look reasonable on UMAP, so I’ll proceed with biological interpretation.”
After Clustering Trees:
“I have systematically validated clusters with quantitative stability metrics, and I can demonstrate their robustness across parameter ranges.”
Publication and Reproducibility Benefits Link to heading
Enhanced Scientific Credibility:
- Quantitative validation improves reviewer confidence
- Systematic methodology demonstrates analytical rigor
- Reproducible results enhance scientific impact
- Transparent documentation enables method adoption
The Quality Cascade Effect Link to heading
Downstream Analysis Improvements:
Quality clustering validation creates a cascade of improvements throughout your analysis pipeline:
Better Clusters → Cleaner DE Results → More Confident Annotation → Trustworthy Biology → Reproducible Discoveries
🔥 Pro Tips for Clustering Tree Mastery Link to heading
Essential Best Practices Link to heading
Comprehensive Parameter Sampling:
- Test wide resolution ranges (0.1-1.5) to capture full clustering landscape
- Use fine increments (0.1 steps) to detect stability boundaries accurately
- Include multiple algorithms to identify method-independent stable populations
Stability Threshold Guidelines:
- High confidence: Stability scores > 0.8
- Moderate confidence: Stability scores 0.6-0.8
- Low confidence: Stability scores < 0.6 (treat with caution)
Documentation Standards:
- Save tree plots for all major analyses
- Record parameter choices and justifications
- Document stability scores for clusters used in downstream analysis
Common Pitfalls to Avoid Link to heading
Over-Interpreting Unstable Clusters:
Don’t build biological stories around low-stability clusters without additional validation.
Ignoring Algorithm Differences:
Always compare multiple algorithms and prioritize clusters that are stable across methods.
Resolution Tunnel Vision:
Don’t fixate on a single resolution value - consider the full stability landscape.
🔥 The Bottom Line Link to heading
Clustering trees transform clustering from an art into a science. They provide the quantitative framework needed to distinguish genuine biological populations from computational artifacts, ensuring that your downstream analysis builds on solid foundations.
The visual evidence from the IFNB clustering trees demonstrates that algorithm choice isn’t just about preference - it’s about scientific quality. Leiden’s superior optimization translates directly into more stable, more reproducible, and more biologically meaningful clustering results.
In the era of increasingly complex single-cell datasets, we can no longer afford to trust clustering results based on visual appeal alone. Systematic validation using tools like clustering trees is essential for maintaining scientific rigor and ensuring that our computational discoveries translate into genuine biological insights.
The investment in proper clustering validation pays dividends throughout your entire analysis pipeline. Every hour spent validating cluster quality saves days of confusion later, and every cluster you can trust with confidence becomes a foundation for reliable biological discovery.
Ready to move beyond guesswork and validate your clusters with quantitative evidence?