There is a gap in every single cell project that nobody puts on a workflow diagram. It sits between “the pipeline finished successfully” and “I understand what is in this dataset.”
Cell Ranger tells you that you have 12,483 cells at a median of 4,100 genes each. It does not tell you that cluster 7 is a doublet artefact, that your treated and untreated samples separated by batch rather than biology, or that the gene your PI cares about is expressed in exactly forty cells sitting at the edge of an otherwise unremarkable population.
Closing that gap is exploratory data analysis, and most of us do it badly. Not because we lack skill, but because we do it in an environment that charges us far too much for each question we ask.
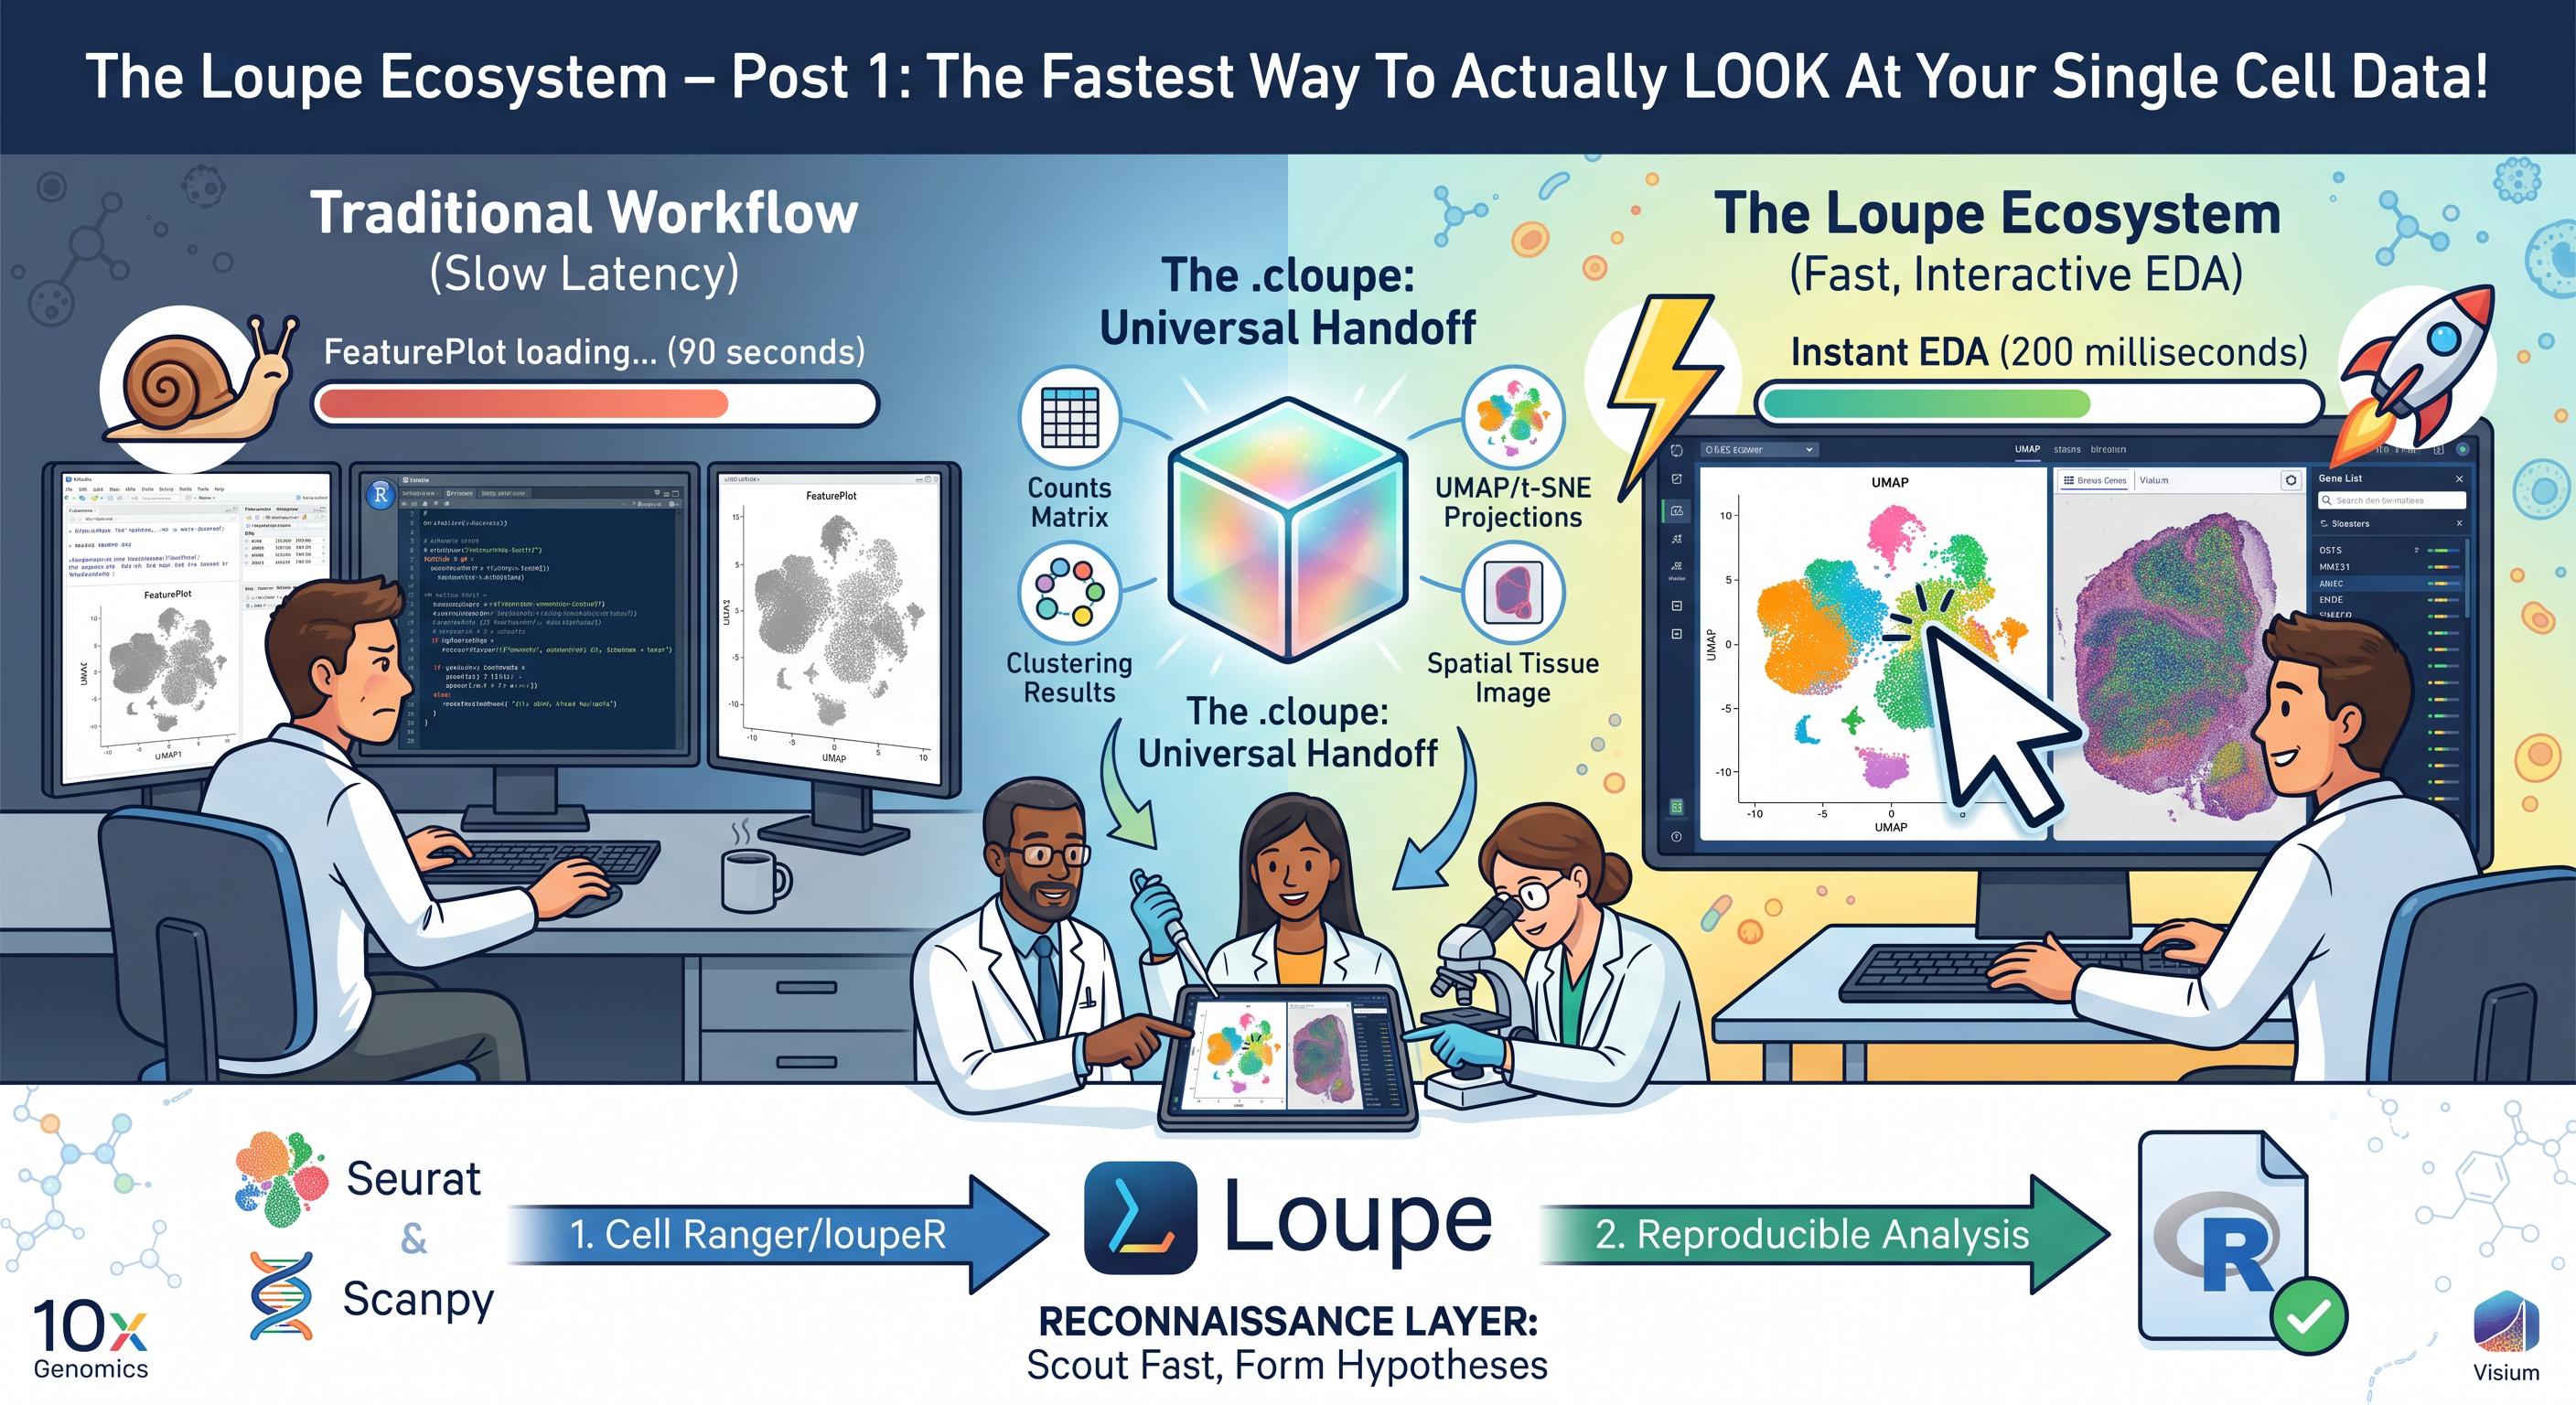
Exploratory analysis is a latency problem ⏱️ Link to heading
Think about what actually happens when you explore a Seurat object.
You type FeaturePlot(obj, features = "PDGFRA"). You wait for ggplot2 to render. You squint at the RStudio plot pane, which is too small, so you zoom it. You decide you want it split by condition. You retype the call with split.by = "condition". You wait again.
Call it ninety seconds per question, and that is generous if your object is large.
It sounds trivial until you consider what it does to your behaviour. At ninety seconds per question, you ask five or six questions and then move on, because you have already formed a working hypothesis and checking it further feels like procrastination. At two hundred milliseconds per question, you ask fifty. You follow tangents. You check the thing that probably will not pan out, and occasionally it does.
This is not a minor efficiency argument. The number of questions you can afford to ask directly determines the quality of the hypotheses you generate.
Exploratory analysis is fundamentally a latency problem, and the tool that wins is the one with the shortest loop between curiosity and answer.
Loupe Browser has a very short loop.
What Loupe Browser actually is 🔍 Link to heading
Loupe Browser is a free desktop application from 10x Genomics, available for macOS and Windows, currently at version 9.1. As the overview documentation explains, it is named after a jeweller’s loupe, the small magnifier used to inspect the details of precious stones, and the metaphor is more apt than most product names manage.
It opens a single file type: the .cloupe. This is a self contained binary container that packages, in one artefact:
-
Counts matrix: the full matrix for every barcode
-
Clustering: precomputed graph based clustering and K-means from K=1 to K=10
-
Projections: dimensionality reductions, typically UMAP and t-SNE
-
Spatial layers: for spatial datasets, the spot or bin coordinates, spot alignment information, and a tiled version of the tissue image so that zooming stays responsive
You double click it and it opens. There is no environment to activate, no dependency to resolve, no renv::restore() that fails because someone bumped a Bioconductor version. This matters more than it sounds like it should.
Loupe supports data from the Chromium and Visium platforms: 3’ and 5’ Single Cell Gene Expression, Feature Barcode assays, Fixed RNA Profiling (Flex), Single Cell ATAC, Single Cell Multiome ATAC plus Gene Expression, Visium Spatial Gene Expression and Visium HD.
Xenium data is the notable exception. It has its own dedicated application, Xenium Explorer, which is worth knowing so you do not go looking for it in the wrong place.
The collaboration problem nobody solves with code 🤝 Link to heading
Here is the situation that made me take Loupe seriously rather than treating it as a toy.
I had an integrated, annotated Seurat object representing several months of work. My collaborator, who generated the tissue and knows the biology far better than I do, wanted to look at it.
My options were:
-
Static exports: send PDFs of every plot I could anticipate them wanting
-
A Shiny app: build it, then maintain a server for it
-
A shared screen: sit in a room and drive RStudio while they tell me what to click
All three are bad. The first is a guessing game about what they will want to see. The second is real infrastructure work that will rot within a year. The third means every question they have after that meeting comes back to me as an email.
A .cloupe file solves this cleanly. It is one file. You put it on a shared drive. Your collaborator opens it and explores the data on their own schedule, following their own instincts, asking questions you would never have thought to anticipate.
Wet lab colleagues, pathologists, clinicians and PIs almost never run R. This is the format that meets them where they are.
Where Loupe sits in the workflow 🧭 Link to heading
The common assumption is that Loupe is a downstream viewer, something you open at the end. That is only half true, and the other half is genuinely useful.
Downstream, it is your reconnaissance layer. You open the .cloupe immediately after the pipeline finishes, before you write any analysis code, and you spend twenty minutes forming impressions. Do the clusters correspond to plausible biology or to technical structure? Does your marker gene of interest look convincing or does it look like ambient RNA? Is there an obvious population you were not expecting?
The single cell navigation tutorial is the fastest way to learn the interface, and there is a parallel one for spatial.
Upstream, for spatial work, Loupe is part of the pipeline itself. The manual fiducial alignment wizard, tissue selection, and CytAssist to microscope image registration all happen in Loupe Browser, and you export a JSON file that Space Ranger consumes via --loupe-alignment.
If your automatic fiducial detection failed, Loupe is not optional. It is the fix.
So it bookends the spatial workflow rather than trailing it.
What Loupe is not ⚠️ Link to heading
I want to be direct about this, because enthusiasm for a tool is worth very little without an honest account of its boundaries.
Loupe is not a replacement for Seurat or Scanpy, and it is not trying to be.
Clicking is not reproducible. Nothing you do in Loupe leaves a record that another person, or future you, can rerun. If a finding is going into a figure, it needs to be re-derived in code, in a script, with a seed set and a session info block at the bottom.
The right mental model is a division of labour:
-
Loupe: hypothesis generation, where speed matters and reproducibility does not
-
Your scripted pipeline: hypothesis testing and the permanent record, where the reverse is true
Trying to make Loupe do the second job will frustrate you. Trying to make R do the first job at Loupe’s speed is what most of us have been doing by default, and it is slower than it needs to be.
It is worth being precise about the statistics, because Loupe is often dismissed on this point unfairly. Its differential expression uses the same method as Cell Ranger: an exact negative binomial test using the sSeq method, switching to the fast asymptotic negative binomial test from edgeR at high UMI counts. The algorithm documentation is public and the implementation is open source. That is a legitimate method, not a shortcut.
The real limitation is design rather than test statistic. Standard cluster versus rest comparisons treat individual cells as replicates, which inflates significance in exactly the way everyone now recognises. You cannot specify covariates or a design matrix.
Loupe’s multi sample differential expression does address this properly with a pseudobulk aggregation, but for anything you intend to defend in review, build the model yourself with DESeq2 or edgeR on pseudobulk counts.
The three pieces 🧩 Link to heading
The ecosystem has three components, and the rest of this series covers the second two in detail.
Loupe Browser is the application. Free, no licence key, currently v9.1, with a native Apple Silicon build added in June 2026. Grab it from the download centre, and skim the release notes if you want to know what changed between versions.
.cloupe files are produced automatically by Cell Ranger and Space Ranger. If you have run either pipeline, you already have one, whether you noticed or not. Post 2 covers what is in it and what you can do with it.
loupeR is an R package, developed and maintained by 10x Genomics, that converts Seurat objects into .cloupe files. This is the bridge that lets your actual analysis, integrated and annotated and subclustered, reach people who do not write code. Post 3 covers it, including the several gotchas that will otherwise cost you an afternoon.
Getting started 🚀 Link to heading
Download Loupe Browser. Find the most recent Cell Ranger or Space Ranger run on your system. Look for outs/cloupe.cloupe. Double click it.
Spend twenty minutes clicking around before you decide whether this is useful to you. Search for a gene you know well and watch how fast the projection recolours. Lasso a group of cells and see the differentially expressed genes appear.
Then think about how many of those questions you would have bothered to ask in RStudio.
That comparison is the whole argument.
Documentation 📚 Link to heading
What’s next Link to heading
Post 2 opens up the .cloupe file itself: what Cell Ranger and Space Ranger put in it, what the interface lets you do with it, and where the format’s limits actually bite.